 Global stock markets have performed strongly during 2017, pushing many broad market US and international indices to new highs. While investors welcome the performance, many also question whether they should reduce their exposure to stocks. The answer typically depends on their financial position relative to goals, investment horizon, and tradeoffs such as taxes. Investors with sufficient assets nearing retirement might consider reducing stock positions to reduce expected volatility. However, investors needing growth over long investment horizons might consider staying invested, as stock markets have historically rewarded long-term investors, even after market highs.
Historical Performance Review
To illustrate, we review the performance of the S&P 500 Index one year after new monthly highs from January 1926 to October 2017. Although the S&P 500 Index is comprised of large US companies, it can provide helpful context about broader market behavior because of its long history. Below, we highlight three main points about the index, which
- Commonly reached new highs (30% of monthly closings)
- Was typically higher one year after a new high (81% of the time)
- Averaged 14% return one year after a new high
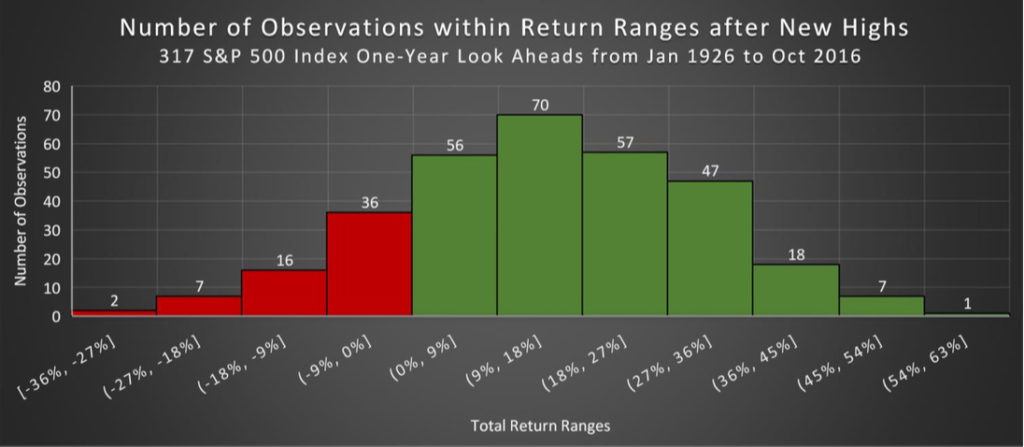
Historical Distribution of Returns
Next, we review the distribution of returns to understand the historical likelihood and magnitude of gains and losses. The red bars represent losses and the green bars represent gains over one-year periods following a new high. The two observations on the far left occurred during the Great Depression and Great Recession, but we see more green than red, and the most common outcome was a gain of 9% to 18%.
Summary
In summary, investors might question whether new stock market highs signal downturns, but the history of the S&P 500 Index shows a broad range of outcomes and most often gains over one year following a new high. To make meaningful decisions about whether to reduce exposure to stocks, investors should balance their savings rates, investment growth rates, and portfolio volatility within a goals-based framework. This will increase the likelihood of achieving their goals.
New Month-End High: 329/1101 monthly observations from Jan 1926 to Oct 2017; 1089 annual observations from Jan 1926 to Oct 2016
For illustrative purposes only. Total Returns in USD. Indices are unavailable for direct investment. Past performance does not guarantee future results.
January 1990 – Present: S&P 500 Index, Standard & Poors Index Services Group;
January 1926 – December 1989: S&P 500 Index, Ibbotson data courtesy of © Stocks, Bonds, Bills and Inflation Yearbook™, Ibbotson Associates, Chicago.
Story by Josh Clifford